


2-minute read
Are you feeling confident?
When you look as good as I do…
You know who isn’t feeling confident apparently?
Who?
The US consumer:[1]

Who exactly is the “US consumer”?
The US consumer is anyone purchasing goods or services for personal use as opposed to commercial purposes. There are approximately 134 million households that make up the US consumer.[2]
Why is their confidence in the tank?
Survey respondents cited inflation, political instability, and perceptions of a weakening employment market. Consumers were generally getting more pessimistic about the year ahead.[3]
Not to sound insensitive, but do their feelings actually matter? Should this worry us at all?
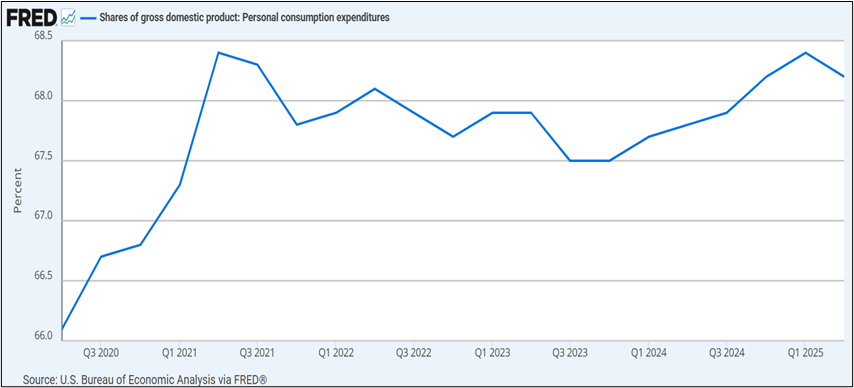
Great question! Turn your attention to this chart:
What am I looking at?
This is a chart of personal consumption expenditures as a percentage of GDP. In layman’s terms, this illustrates how much of the American economy is driven by us buying stuff – TVs, vacations, dinners, etc.
Almost 70% of our economy is driven by the US consumer buying those types of things?
You got it.
Is that a lot?
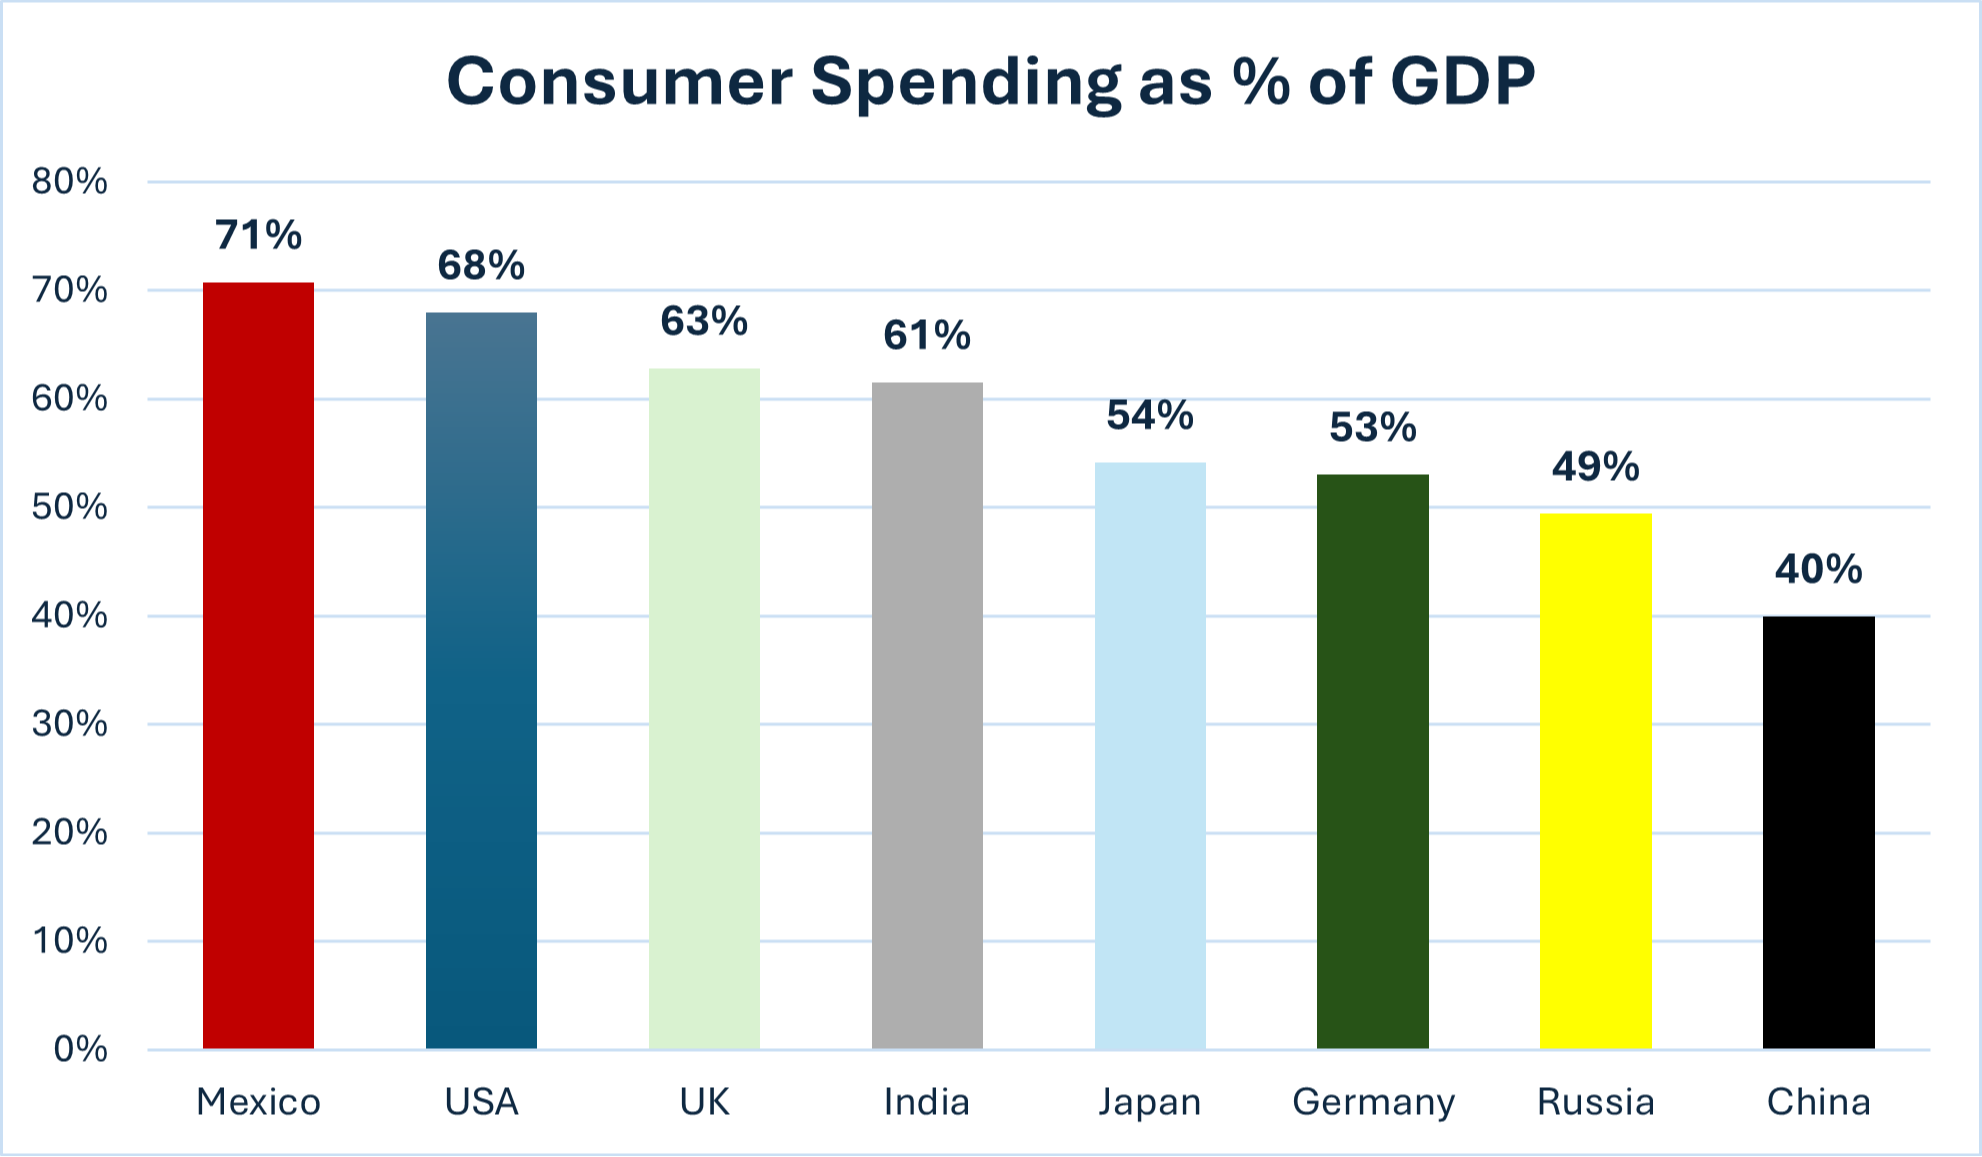
Here it is relative to other major countries:[4]
So we’re up there?
We’re close to the top of the list when it comes to major developed nations. In short, Americans love buying s@#%.
But it looks like we’re falling out of love with buying s@#%. Doesn’t that spell trouble?
What kind of trouble are you referring to?
Trouble as in the stock market tanking. If the consumers run the economy and the market generally follows the economy, then what else is there to assume?
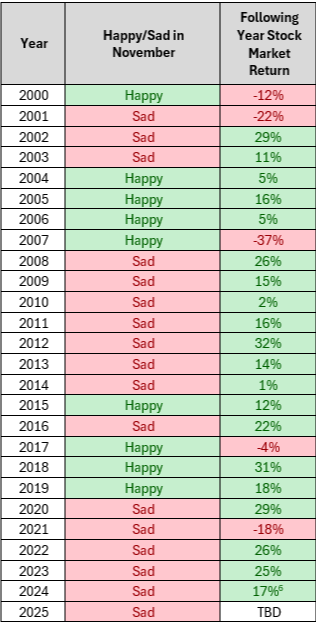
Here’s what history says:[5]
Can you please explain?
The middle column provides the sentiment of the US consumer going into the holiday season. The right column shows the total return of the S&P 500 the following year.[1]
Ahh so we want to see if bad consumer sentiment can leak into the next year?
Right, and fortunately, poor sentiment doesn’t appear to be a good indication of what’s to come. For example, sentiment was awful coming out of the 2008 Great Financial Crisis and there were 9 straight years of investment gains.
Got it. So what are you expecting this time around?
Two things: I expect retail shopping data to be okay while the high-end consumer drives spending. I expect sentiment to be a lousy indicator of the stock market.
And what about the stock market in 2026?
Does my prediction matter at all?
Nope.
Then have a blessed holiday season!
________________________________________________________________________________________________________________________
[1] Source: https://finance.yahoo.com/news/us-consumer-confidence-tanks-in-november-as-americans-see-more-financial-pain-ahead-152417642.html
[2] Source: https://www.bls.gov/regions/midwest/data/consumerexpenditures_selectedareas_table.htm#:~:text=Bureau%20of%20Labor%20Statistics%20%3E%20Geographic,%2C%20South%20Dakota%2C%20and%20Wisconsin.
[3] Source: https://www.foxbusiness.com/economy/consumer-confidence-falls-sharply-americans-worry-about-economy
[4] Sources: https://kidb.adb.org/explore?filter%5Bindicator_id%5D=2200011&filter%5Beconomy_code%5D=DEV%2CAUS%2CAUS%2CAUS_10%2CAUS_20%2CAUS_30%2CAUS_40%2CAUS_50%2CAUS_60%2CAUS_70%2CAUS_80%2CAUS_110%2CAUS_120%2CAUS_130%2CAUS_140%2CAUS_150%2CAUS_160%2CAUS_170%2CAUS_180%2CJPN%2CNZL%2CNZL%2CNZL_10%2CNZL_20%2CNZL_30%2CNZL_40%2CNZL_50%2CNZL_60%2CNZL_70%2CNZL_80%2CNZL_90%2CNZL_100%2CNZL_110%2CNZL_120%2CNZL_130%2CNZL_140%2CNZL_150%2CNZL_160%2CNZL_170&filter%5Byear%5D=2000%2C2001%2C2002%2C2003%2C2004%2C2005%2C2006%2C2007%2C2008%2C2009%2C2010%2C2011%2C2012%2C2013%2C2014%2C2015%2C2016%2C2017%2C2018%2C2019%2C2020%2C2021%2C2022%2C2023%2C2024%2C2025&grouping=indicators&showRegions=true // https://data.worldbank.org/indicator/NE.CON.TOTL.ZS
[5] Source/Methodology: https://fred.stlouisfed.org/series/UMCSENT# // Happy/Sad designations were determined by calculating the historical average for all months in the survey (84.78). Happy November readings were above that number and Sad readings were below.
[6] YTD through November 28, 2025
[7] S&P 500 data: https://www.slickcharts.com/sp500/returns