


We’re almost three-quarters of the way through the year and guess where the market1 stands?
Eh, I don’t know, up 10%?
That’s what it feels like, doesn’t it? But the reality is it we’re up closer to 20%2.
That is kind of weird; especially considering the inflation data, lingering covid issues, and the recent expiration of federal unemployment benefits.
Exactly. The stock market’s historical average dating back to 1926 is around 10%. We’re nearly doubling that. Yet I still feel a sense of cautious optimism and even some impending doom among people.
So what exactly is going on? I thought there was some weird stuff happening in the markets.
Weird stuff as in cryptopunks, stablecoins, EtherRocks, etc.?
Yep. That’s some crazy s$#@.
And I’m sure you caught the Evergrande news from China?
I did. The “Chinese Lehman Brothers” people are saying. That’s a little scary.
And how about the allegations of the World Bank fudging their ‘Doing Business’ country rankings? That’s a weird one.
It sure is. Can’t escape the weirdness I guess.
You want to know the weirdest thing that’s happening in the market right now?
Let’s hear it.
The lack of volatility.
Is that right…
Take a peek at this graph:
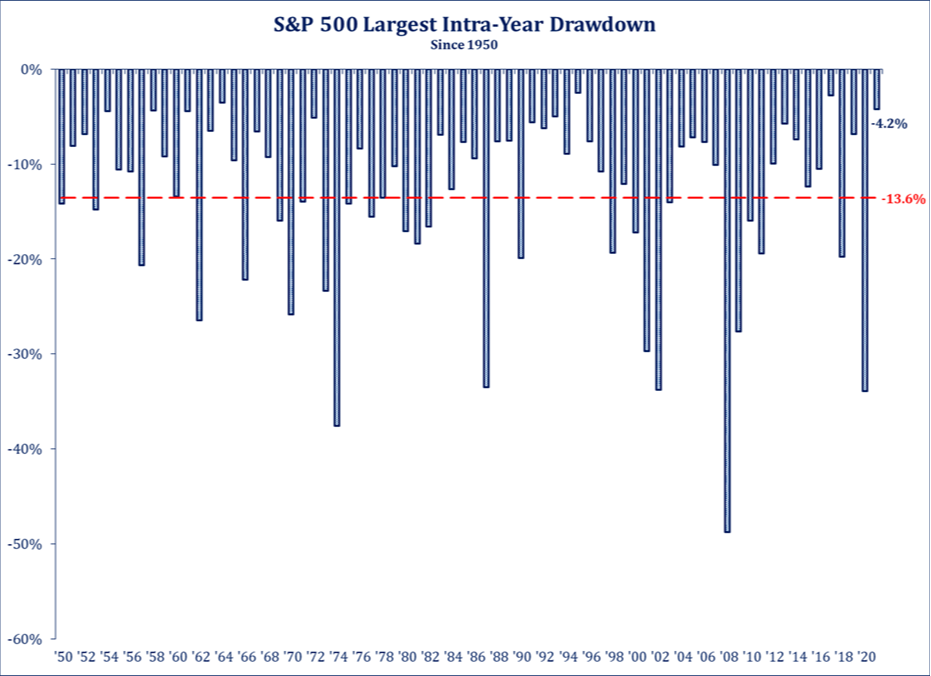
Too many bars. Explain…
Since 1950 the average peak-to-trough drawdown during a calendar year is 14%. You can see there are several years (28 to be exact) where the intra-year drawdown was worse.
And it looks like the worst drawdown from market top to bottom has been around 5%3 this year?
That’s correct. The market has only seen 4 days where it was down 2% or more. Last year gave us 25 of these such days. 2020 saw 16 days where the market was down 3% or more.
Tough to compare any year to 2020, though.
Agreed, thankfully we don’t see many years quite that crazy. But consider the fact that since 1980 the market has seen a double-digit pullback in 21 of 41 calendar years. We haven’t even sniffed a double digit pullback in 2021.
So do you think we’re due for one?
Obviously it’s impossible to know, but there is still some very positive news to report. For example, companies in the S&P have raised their collective earnings by 42% over the past year. Operating margins continue to rise. Monetary policy continues to be market friendly.
I get it, but it just seems too smooth of a ride. Something’s gotta give.
You could definitely make that argument, and there are some warning signs if you dig a bit deeper. While the S&P is only around 4% off from its highs, the “average stock” is down closer to 13%. The percentage of individual stocks in the S&P trading above their 50-day moving average has been declining since the spring.
So the trends aren’t favorable for a good end to the year?
Anyone can cherry pick data points to fit their narrative but I understand if people are concerned. Non-farm employment gains fell dramatically from their June/July levels. GDP estimates are being pared back among forecasters. Meanwhile, our Congress is navigating a debate of over $3 trillion in spending.
So I’m not crazy if I’m a bit worried about a bumpy winter?
Not at all. Equity investors historically have had to endure tough stretches in exchange of long-term gains. We get a little weary when that’s not the case. Feel free to give your advisor a call sometime soon. I bet their phone has been very quiet this year – just like the market.
1 The “market” in this case is the S&P 500.
2 S&P return as of September 22, 2021.
3 As of September 21, 2021