


Check out this graphic I recently came across from the Wall Street Journal:
Too many colors. What’s the deal here?
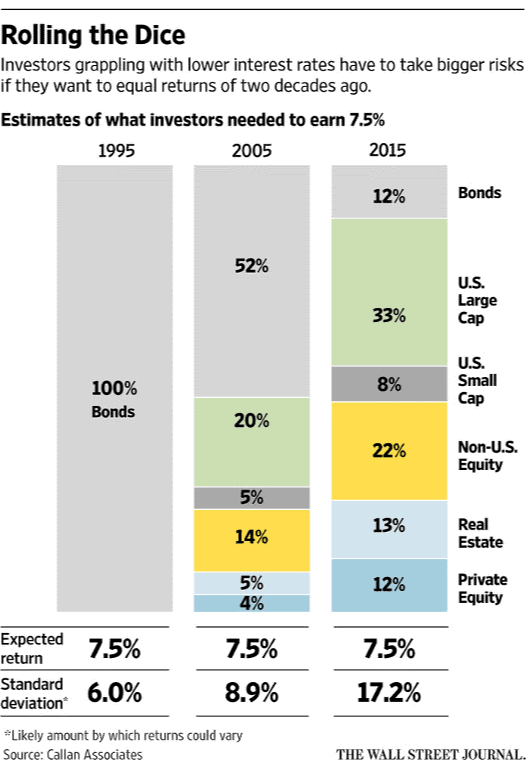
This illustration estimates the required asset allocation one would need to reach an annual return of 7.5%. Each bar represents asset allocations from 1995, 2005, and 2015, respectively.
Looks far more colorful on the right side.
Correct. In 1995 an investor could just plop their entire portfolio in boring bonds and receive a 7.5% return. That changes drastically a decade later. The percentage of bond exposure then drops even more precipitously ten years after that to 12%.
Okay you’ve explained the lighter grey sections of the graphic, how do the other colors factor into this?
Those colors represent different types of investments, different asset classes. They’re a mix of stocks, real estate, and private equity.
How much more risk is involved in those?
Look at the bottom row titled, “Standard deviation.” Standard deviation is a measure of volatility in an investment portfolio. Higher volatility is often equated with higher risk for investors.
So, a fair amount of additional risk then?
That’s one way to put it. To achieve a 7.5% return in 2015 meant taking on almost three times the amount of risk as it did in 1995.
Well, that sucks. Could this trend reverse?
It could, but consensus opinion doesn’t think so. Let’s look at another graph:
This is one of those correlation charts, right?
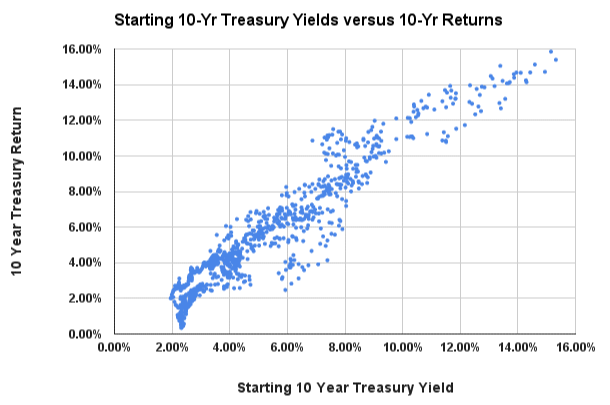
Yep. This particular chart is showing the relationship between starting treasury yields and treasury bond performance going forward. As you can tell, the correlation is pretty tight.
Meaning what exactly?
If you invest in bonds when the 10-year treasury is higher, historically your performance on those bonds has been good. If you buy bonds when the 10-year treasury is lower, your forward performance has been not so good.
Where is the 10-year treasury yield today1?
1.62%.
That doesn’t sound too high…
Indeed. To put it in context, the 10-year treasury yield peaked in 1981 when it hit 15.84%. So by historical standards, yes, we are quite low.
Do I ditch my bonds tomorrow?
Not necessarily. Bonds have provided safety when the stock market goes south. Seeing stocks rise for over a decade can make us forget the pain of corrections. Bonds can ease some of that pain. Consider this chart:
I’ve had my fill of charts at this point of the conversation. Explain…
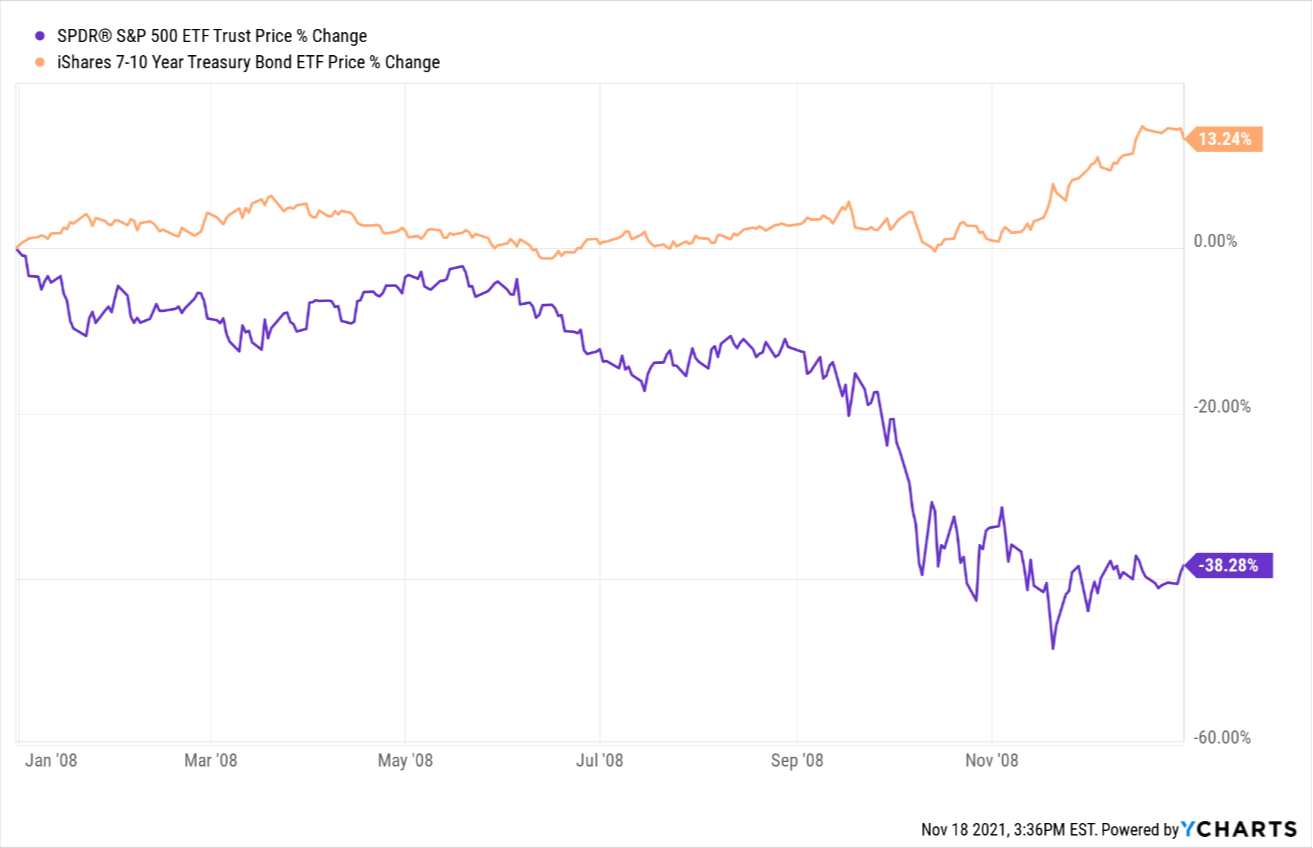
This is the performance of the S&P 500 against the 7-10 year treasury bond index in 2008. While the market tanked almost 40%, treasury bonds rose 13%.
But we are 13 years out from ’08. And you said bonds are crap right now. Would bonds really be a good hedge still?
They were a short 20 months ago. When the world turned upside down in February/March 2020, the S&P lost 34% and treasuries gained 6%. I’d say that’s a decent hedge.
Hard to argue with that. But the fact still remains that over the long haul you will have to hold more stocks in order to produce solid returns?
There’s probably no escaping that. Investors will have to endure more volatility in their portfolios to significantly grow their savings and outpace inflation.
And what’s your advice on how to do that over a multi-year period?
First, do not take more equity risk than is necessary to reach your goals, especially if you’re one to press the sell button during corrections. If you can’t help yourself, that may signal the time to chat with an unbiased third party. Until then, here’s to continued bull market…
1 Today being November 16, 2021